We are going to learn:
math
library.
MediaLib can be used in conjunction with other Python libraries. For example, you can also plot and change the colors, sizes, line types, fonts, etc. of charts using matplotlib. See the official documentation for more details https://matplotlib.org/stable/contents.html
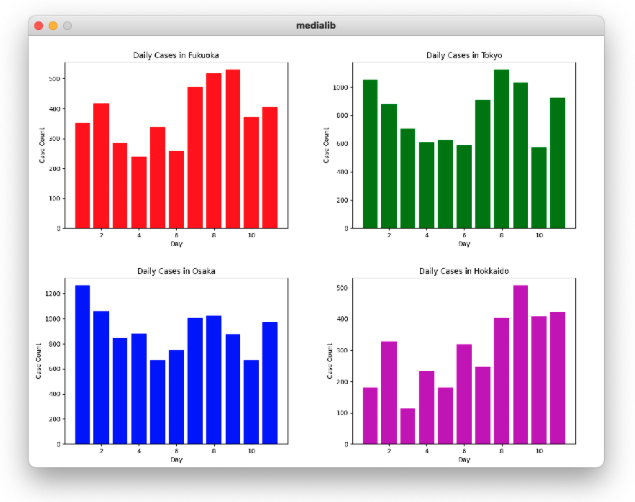
Download the Medialib ex3 files from the gallery and complete the program in ex3.py to display four plots at once. It is not necessary to use the same design (type of graphs, colors, labeling, ...) as the example.
In lines 14 to 22, as shown below, we have defined a function to load the data fromdata.csv
.Day | Fukuoka | Tokyo | Osaka | Hokkaido | |
---|---|---|---|---|---|
1 | 352 | 1050 | 1262 | 180 | |
2 | 417 | 879 | 1057 | 326 | |
3 | 285 | 708 | 847 | 114 | |
4 | 239 | 609 | 884 | 233 | |
5 | 337 | 621 | 668 | 181 | |
6 | 259 | 591 | 747 | 320 | |
7 | 472 | 907 | 1005 | 248 | |
8 | 519 | 1121 | 1021 | 403 | |
9 | 529 | 1032 | 874 | 506 | |
10 | 372 | 573 | 668 | 409 | |
11 | 404 | 925 | 974 | 421 |
data, colour, title, labels, file_name
. Hint: use pyplot.clf()
to clear the figure before drawing the next one.draw()
function of MediaLib to load and draw the figures created in step 1 on the window as shown in the figure below.# Plot the given data to figures with matplotlib | |
# Use medialib to load and show the saved image files of the figures | |
from matplotlib import pyplot as plt | |
from medialib import * | |
initialize() # always the first instruction of the program | |
day = [] # days: 1, 2, 3, ... | |
fukuoka = [] # Number of cases increased each day in Fukuoka | |
tokyo = [] # Number of cases increased each day in Tokyo | |
osaka = [] # Number of cases increased each day in Osaka | |
hokkaido = [] # Number of cases increased each day in Hokkaido | |
# 0. load data from file | |
lines = open("data.csv", "r", encoding="utf-8").readlines() | |
for i in range(1, len(lines)): | |
_nums = lines[i].split(",") | |
day.append(int(_nums[0])) | |
fukuoka.append(int(_nums[1])) | |
tokyo.append(int(_nums[2])) | |
osaka.append(int(_nums[3])) | |
hokkaido.append(int(_nums[4])) | |
# 1. use matplotlib to plot the figures and save to files | |
# you can choose the type of graph you like and customize it | |
# Example: plot the figure (bar chart, green, as an example) for Fukuoka | |
# Remember to remove the following lines after your function is defined | |
plt.bar(day, fukuoka, color="g") | |
# Set up the title, labels, etc. | |
plt.xlabel("Day (in May)") | |
plt.ylabel("Count of Cases") | |
plt.title("Daily Cases Confirmed in Fukuoka") | |
# plt.show() # can uncomment this line for test | |
plt.savefig("fukuoka.png") | |
plt.clf() # clear the figure before drawing the next one | |
""" | |
It is not a good idea to write the above lines another 3 times. | |
So, you are expected to define a function and call it 4 times to do the job. | |
Consider the arguments needed when creating the function. | |
You may call the function like: | |
plot_bars_to_file(day, fukuoka, "r", "Daily Cases in Fukuoka", "Day", "Case Count", "fukuoka.png") | |
plot_bars_to_file(day, tokyo, "g", ...) | |
plot_bars_to_file(day, osaka, "b", ...) | |
plot_bars_to_file(day, hokkaido, "m", ...) | |
to plot the figures. | |
Finally, remember to remove the above example code for a figure of Fukuoka. | |
""" | |
# 2. Use "draw" function of medialib to load and draw the figures on the window | |
# Example: | |
draw("fukuoka.png", 0, 0, 400, 300) | |
# Arguments: filename, x, y, width, height | |
# Consider the coordinates and sizes of other figures. | |
wait_mouse_leftclick() | |
print("done") | |
all_done() # always the last instruction of the program |