Data Visualisation - Lists
Learning Objectives
We are going to learn:
- How to use the
rect()andtext()functions. - How to define new functions.
- How to use data in lists.
text() and rect() Functions
The text() function
text(message,x,y,font_size)
text(message,x,y,font_size, r=None,g=None,b=None)
Writes the message string in the drawing window, at the postion (x,y), with the current font,
and the characters will have the size font_size (measured in pixels). If a color is provided (via
the r, g and b parameters), then the text will be written in that
color. Default color is white.
The rect() function
rect(x,y,w,h,r=None,g=None,b=None)
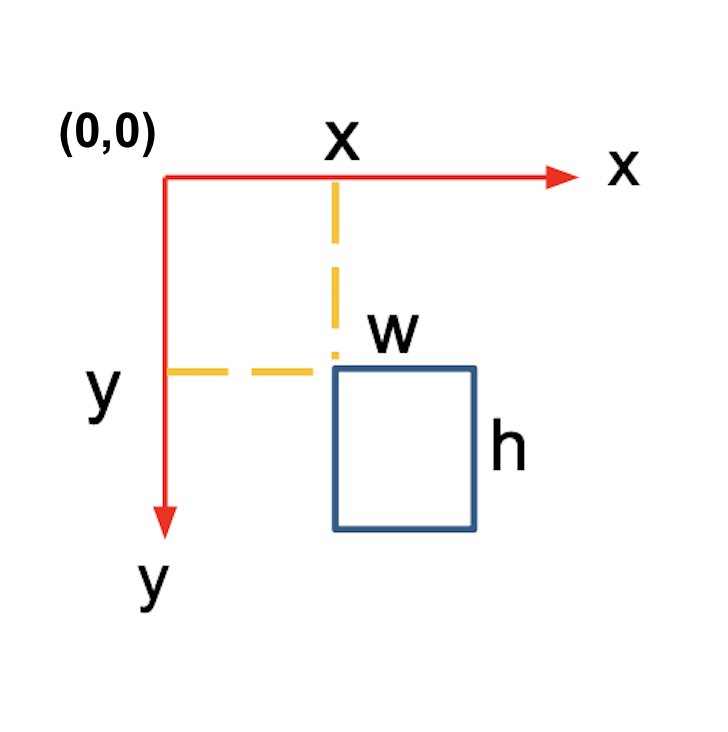
Similar to draw(...). This function draws a rectangle from the point (x,y) to the
point (x+w,y+h).
By default the rectangle border and inner area are white, but a color can be specified (in RGB format).
Example: rect(10,15,100,120)
Reminder: the top-left corner of the screen is at (0,0).

In the code below, we have defined the function draw_horizontal_bar to use the rect function and text function to draw a bar.
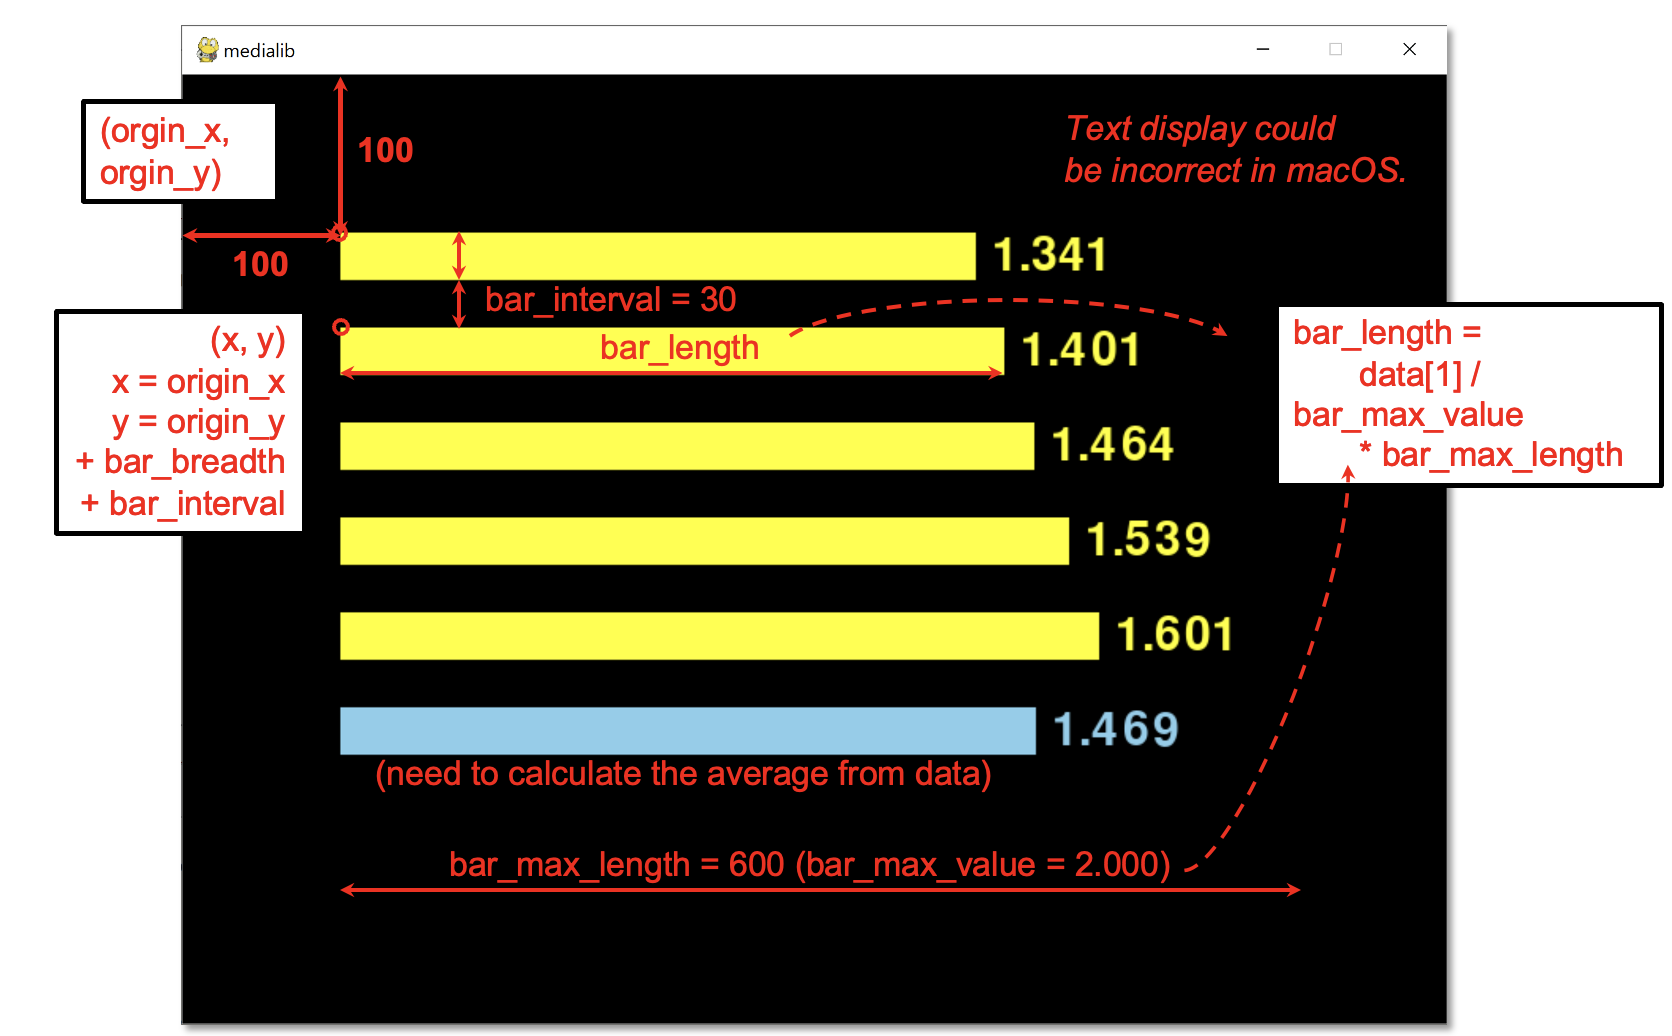
draw_horizontal_bar(value, x, y, bar_breadth, bar_length, r, g, b):
You need to pick the value from the data list and calculate bar_length of it with the bar_max_value and bar_max_length. Use bar_breadth and bar_interval to calculate its top-left coordinate (x, y). Indicate the color with r, g, b values (0~255).
Exercises
Download the Medialib ex2 files from the gallery and complete the program in ex2.py to visualize a list of data and their average with horizontal bars according to the following example and the comments in the program. Feel free to colour and size the bars as you like.


This work is licensed under a Creative Commons Attribution-ShareAlike 4.0 International License.